Anaerobic Digestion model & shiny app 
Motivation
This app is associated with my senior design project in chemical
engineering at Drexel University.1 The model
was developed to simulate the degradation of heavy organic compounds
through anaerobic digestion. Five unique processes take place in the
simulated batch reactor, including the enzymatic hydrolysis of guar gum,
acidogenesis of polysaccharide chains, acetogensis, methanogenesis, and
anaerobic degredation using bacteroides. See the Background of Process
tab within the app for a more detailed process description.
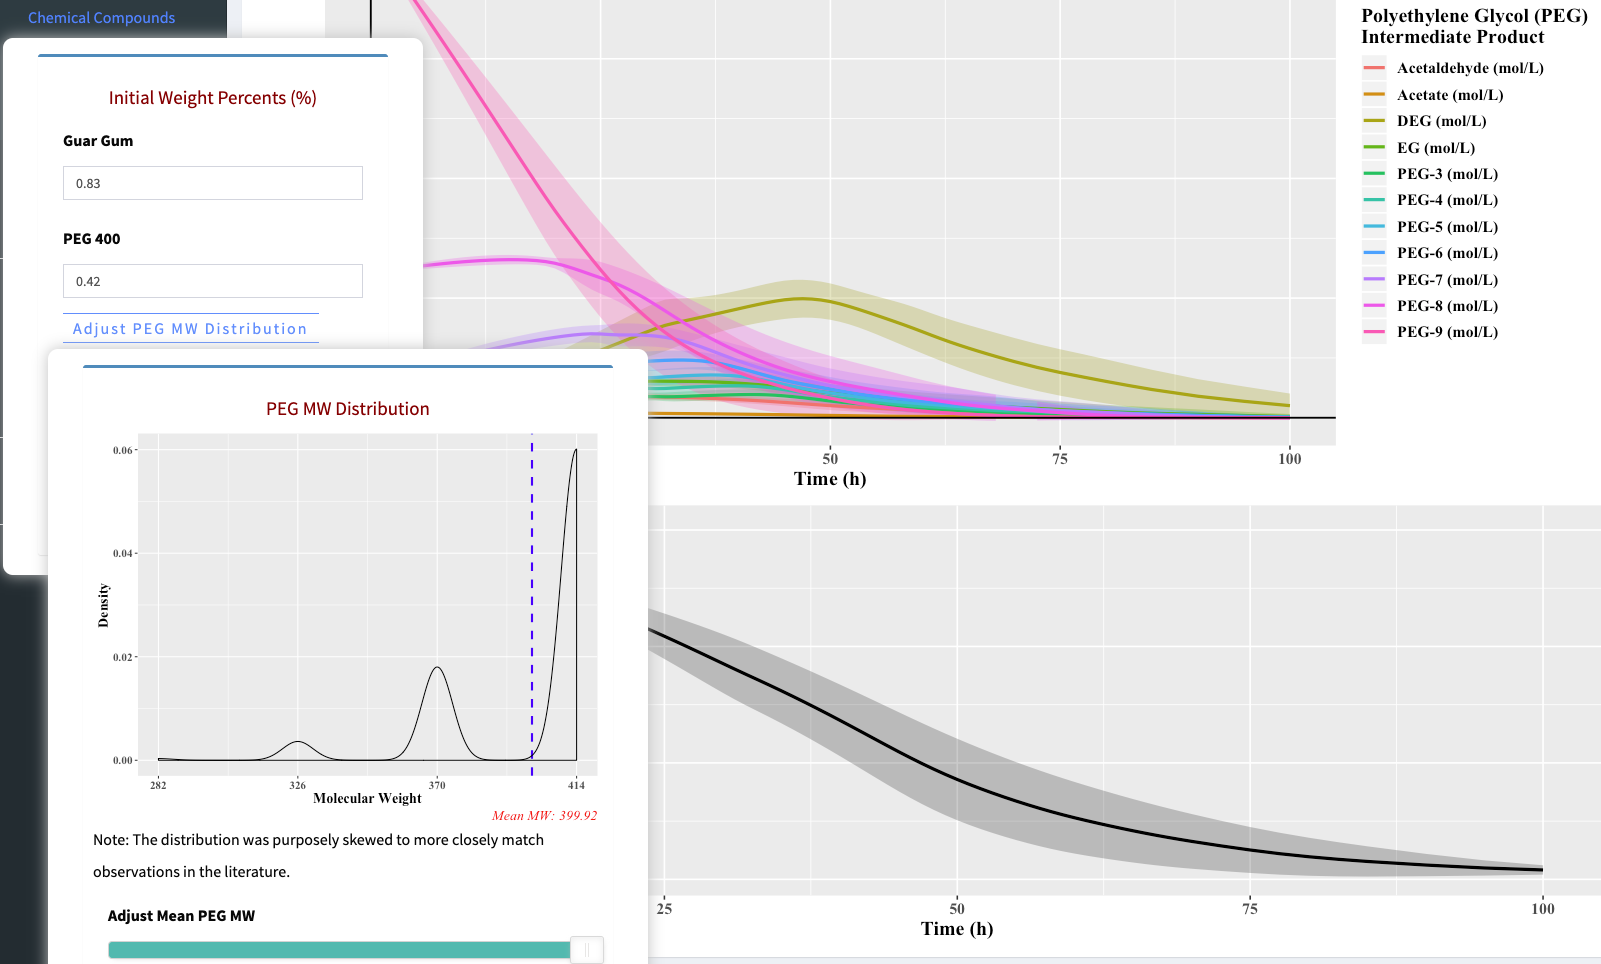
The purpose of this app is to optimize the model parameters in order to increase the profitability of the bioreactor. The user will be able to adjust initial bacteria concentrations, reactor temperature (both static and dynamic), etc., and see a visual representation of the outcome. Note that not all adjustable parameters will have an effect on every plot.
Getting Started
-
The app is currently hosted live here
- Note that some parameter configurations may result in a failed model compilation
-
As soon as the user loads the app, the model is compiled and run using the current parameter settings. As the user adjusts these parameters, the plots and tables will update according to the new settings.
-
The tabs on the left then allow the user to navigate the simulated reactor output and read more about the process. You can also specify the time in which to truncate the data and evaluate the output, though the minimum value is currently 100 h. The reactor that follows the anaerobic digestor is capable of removing small quantities left over. Ideally you would set a minimum acceptable concentration, and optimize parameters to decrease the time required to reduce the contaminants to that concentration, though this not been implemented due to the lack of observational data.
-
A quick walkthrough is available on YouTube:
Prerequisites and Running the App (locally)
Most of the important R packages are version controlled via
pkgr. If using
install.packages() make sure you point to the MPN
snapshot referenced in the
pkgr.yml file.
Installing the above packages prior to running will speed up the initial
loading by a lot. Make sure each of the packages can be loaded via
library(). Note: You will need Rtools (windows) or Xcode (mac)
installed in order to use
mrgsolve. See
footnote for further details on mac install.2
Proposed Reaction Mechanisms
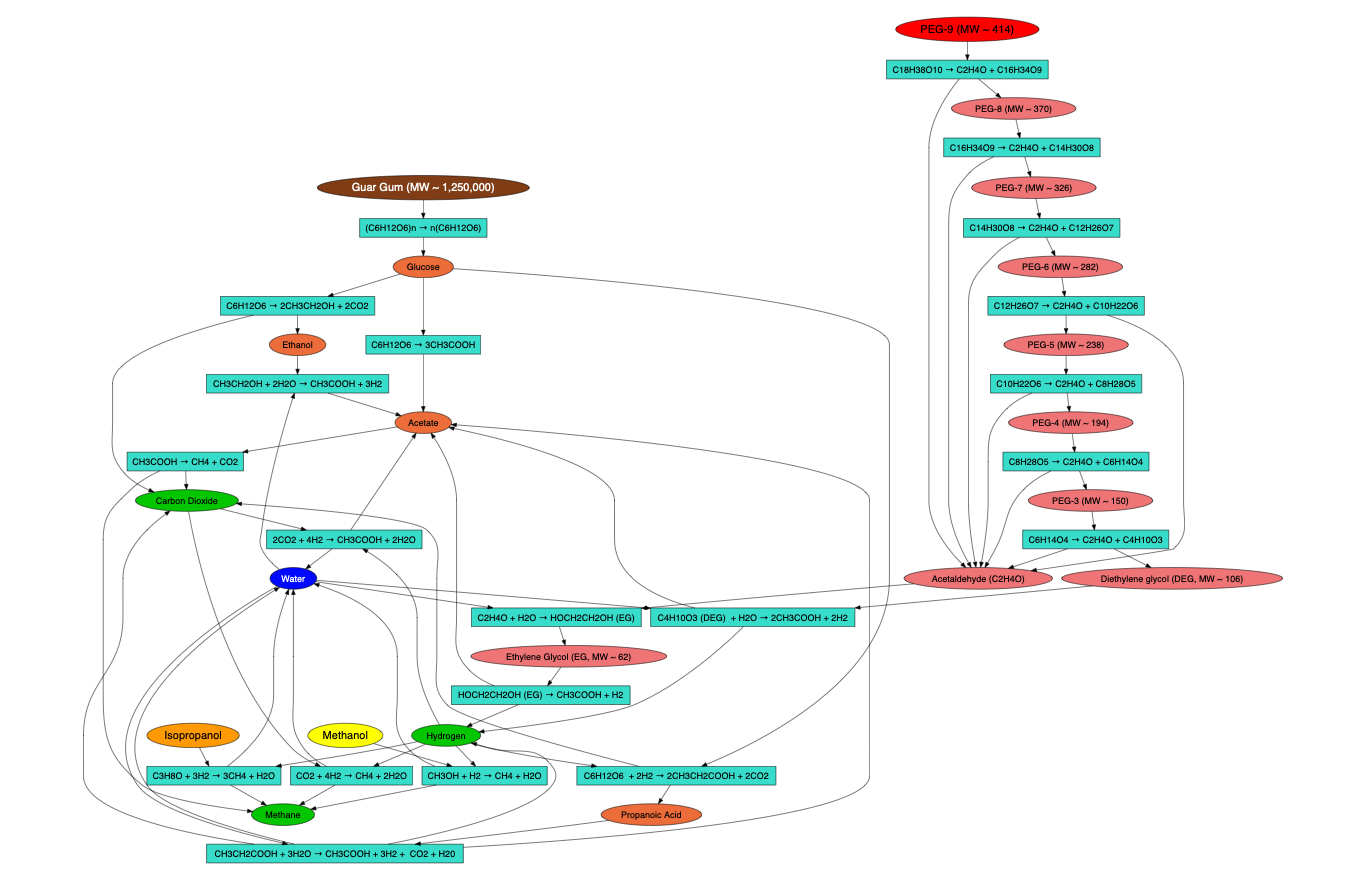
Contaminants being converted in bioreactor:
- Guar Gum (Brown)
- PEG 400 (Red)
- Methanol (Yellow) & Isopropanol (Orange)
- Petroleum Distillates (Not shown)
Below is the overall proposed reaction mechanism. Specific reaction mechanisms are illustrated more clearly within the app.

Side Tabs in App
- Use the
Model Parameterstab to adjust the model inputs. Clicking a category will open a separate menu with adjustable parameters. Click the category again to make the menu disappear. Kinetic variability can be adjusted using theVariabilitytab.

- Use the
Plotstab to view a specific set of plots. Selections include Main Components, Intermediate Products, Bacteria Growth, and Reactor Properties. - Use the
Tablestab to view the input and output concentrations. Selections include Main Components and Reactor Properties. - Use the
Codestab to display and download the model file, AnaerobicDigestionShiny.cpp, or the app.R used for this application. Note that other scripts are needed to run the model. - Use the
Mathematical Modeltab to display the differential equations present in the model. - Use the
Background of Processtab to download a PDF summarizing the model process.
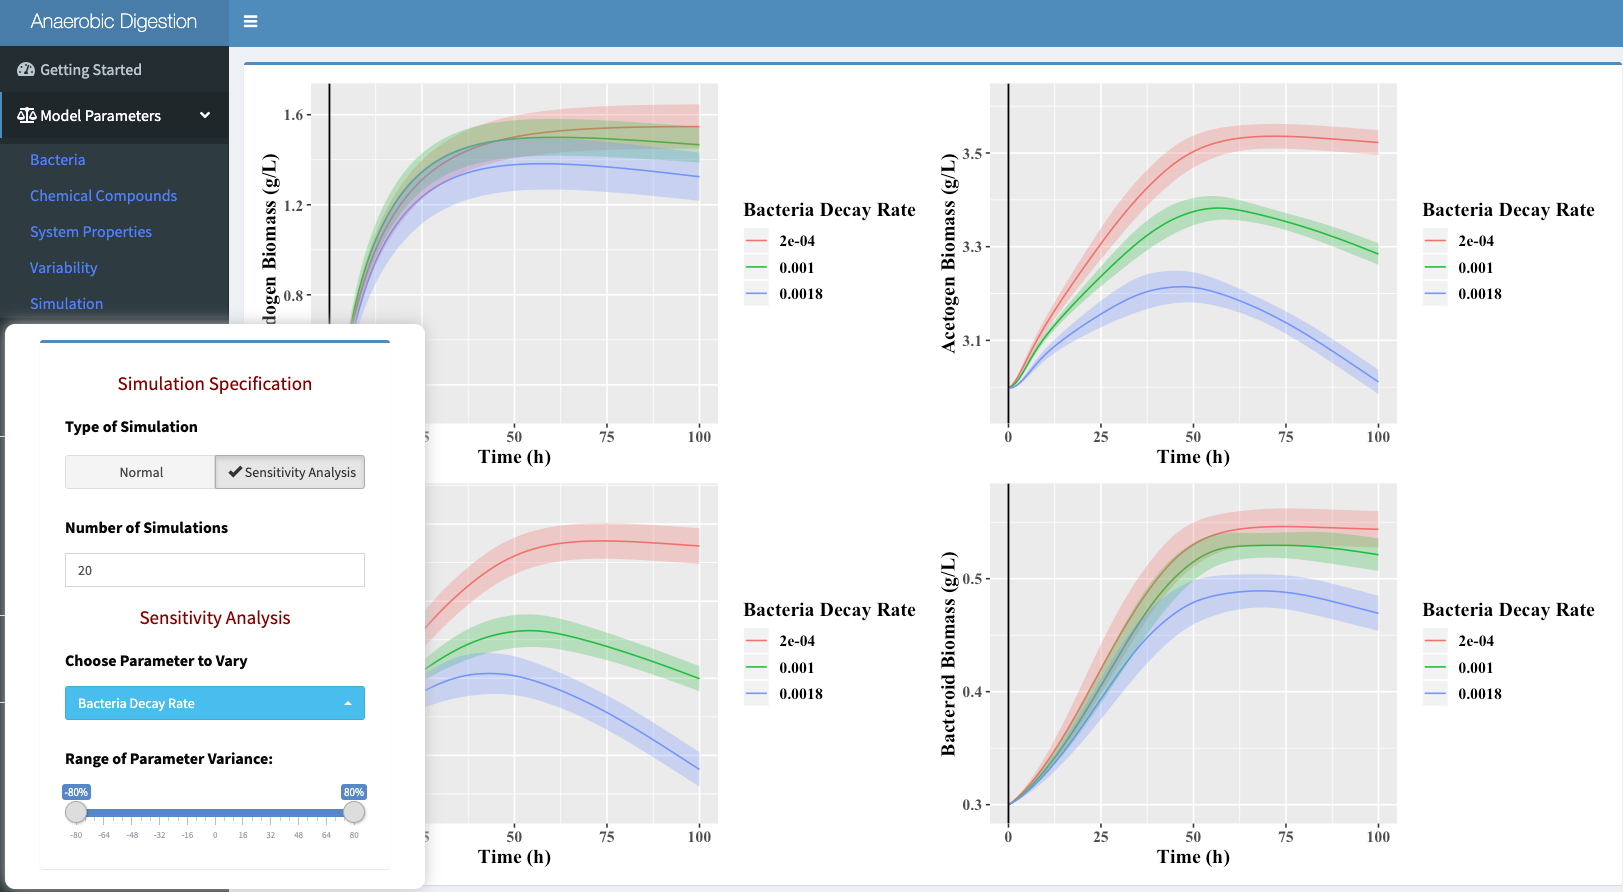
Sensitivity Analysis
The simulation option will allow for a sensitivity analysis of a
chosen parameter. Below is an example of how to perform a sensitivity
analysis on a given parameter:

Acknowledgments
- Author & Developer: Kyle Barrett
- Modeled using mrgsolve - Solving of PDE’s
- For more information about this project, check out the final paper or higher level summary.
